
Key Takeaways
- Q2 marks the most successful first half of an election year since 1976.
- The Fed will hold its next policy meeting July 30-31, though the timing of any future rate cuts will depend heavily on upcoming employment and inflation data.
- Neither high nor low risk tolerance is necessarily good or bad. Each can lead to positive or negative outcomes — or sometimes a bit of both.
In the second quarter of 2024, markets were in a state of flux, reacting to evolving monetary policies and major election results throughout developed and emerging economies. Equity markets experienced a downturn in April, a significant rebound in May, and moderate fluctuations in June.
Nonetheless, equities generally saw a rise over the quarter. Both governmental and corporate long-term bonds faced challenges, while oil retreated slightly following a robust performance in the first quarter.
Q2 in Review
S&P 500’s Remarkable June Performance
The S&P 500 hit seven new closing highs. These new records brought its Year-To-Date (YTD) total to 31, contributing to an overall increase of 3.59% for the month, a three-month gain of 4.28% for Q2, and a 15.29% gain YTD.
This marks the most successful first half of an election year since 1976.
Historical data suggests that when the S&P 500 sees such substantial growth in the first half of the year, the latter half often yields more modest advances.
Volatility in Fixed-Income Markets
Fixed-income markets experienced a bumpy ride for the quarter, finishing slightly higher at the end. There was a noticeable rise in the U.S. two-year and 10-year yields, with an increase of 10 and 15 basis points over the quarter, respectively.
According to Morningstar Direct as of June 30, 2024, the Bloomberg US Aggregate bond index, a widely tracked measure of total returns on U.S. fixed income, was down 0.71%, while the Bloomberg Global Aggregate bond index was down 3.16%.
Commodities Market Trends
The U.S. commodities market finished the quarter with prices rising over 10% compared to the previous year. Particularly noticeable is the increase in non-ferrous metals and rubber prices by 13% and 25%, respectively.
Cocoa’s remarkable price surge has continued due to unfavorable weather conditions in primary production regions and political instability. Conversely, cereals have seen a price dip despite the global rise in rice prices due to weather-related concerns and export restrictions in India.
The oil market echoes the upward trend, riding near a two-month high at quarter end due to increasing tensions in the Middle East and hurricane activity in the Atlantic. Interestingly, the upward trend in Brent crude futures, spurred on by fears of supply disruptions and potential U.S. interest rate cuts, hasn’t translated into profits for refiners, indicating a weak gasoline demand and rising inventories.
What’s Been Driving Markets?
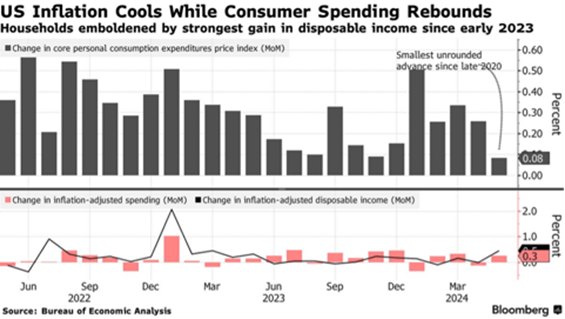
The Economy, Inflation, & the Fed
The U.S. economic performance in Q1 was slightly less than initially observed, with a downward revision of the Gross Domestic Product (GDP) from 1.6% to 1.4%. This, combined with lower inflation readings in April and May, has given the Federal Reserve a bit of runway to contemplate pulling back on interest rates. This decision appears tied to determining whether the economy is moving toward a path of sustainable disinflation.
The Fed will hold its next policy meeting July 30-31, though the timing of any future rate cuts will depend heavily on upcoming employment and inflation data.
Employment Trends
There was a positive boost on the employment front, with nonfarm payrolls exceeding expectations, adding 272,000 jobs. Average hourly earnings climbed 0.4% from April and 4.1% year-on-year. Despite this, the unemployment rate slightly increased to 4%, representing the first rise over 4% in two years.
The job market appears to be moderating in the face of these mixed signals. On the consumer side, sentiment dropped less than predicted, leading some to believe that inflation pressures can be managed without causing extensive harm to consumer spending.
Manufacturing Sector Insights
In manufacturing, May saw a modest increase in new orders for durable goods, driven primarily by a 0.6% rise in transportation equipment. Despite this, the ISM Manufacturing reading signaled contraction, coming in under economists’ expectations.
Big consumer products companies are also dealing with pricing challenges, moving away from “shrinkflation” — raising prices while reducing package sizes — toward “upflation,” creating new product uses and charging more for them.
Navigating Personal Risk Tolerance
Risk tolerance is a critical but often misunderstood aspect of investing. It represents your psychological comfort level with participating in uncertain situations where both success and failure are possible outcomes. However, risk tolerance isn’t just tied to numbers but also carries an emotional component, often being influenced by individual predispositions.
In investing, those with high risk tolerance generally lean toward potentially high-reward situations despite the risk of potential losses. Conversely, those with lower risk tolerance prefer to avoid such perceived threats, focusing more on preserving their initial capital. Remember, neither high nor low risk tolerance is necessarily good or bad. Each can lead to positive or negative outcomes — or sometimes a bit of both.
Furthermore, your risk tolerance isn’t constant, but can change depending on the scenario or over time, so coupling long-term investment decisions with an understanding of your comfort level with risk helps you make informed decisions.
How Investors Should React
The chart below shows the daily returns of the S&P 500 over the past 40 years. This is what it looks like to watch the markets daily. The inconsistent nature of the ups and downs can test your risk tolerance.
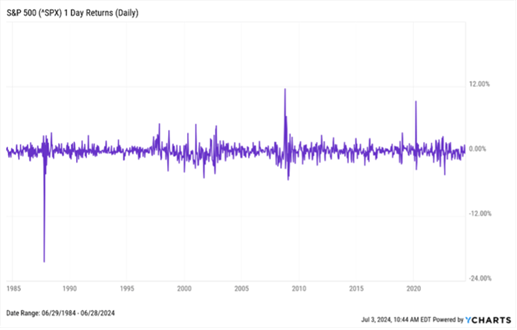
However, if we look at the same 40 years through a different lens, we start to see another story emerge — one that rewards patience and matches the time horizon for long-term investors much better. It is the same ride, with daily ups and downs. Still, shifting perspective helps to validate the rewards of investing and lower the potential signals that negatively trigger risk tolerance.
Eide Bailly Wealth Supports Your Goals
Eide Bailly’s investment philosophy emphasizes holistic financial planning that encompasses all aspects of your financial life. It extends beyond mere investments to include strategic tax minimization and adapting to your personal risk tolerance and evolving market conditions.
Our mission is to steer you toward a wealth-centric approach that aligns with your aspirations, ensuring your portfolio embodies not only your financial goals but also your distinct journey and priorities.
Financial Advisor offers Investment Advisory Services though Eide Bailly Advisors LLC, a Registered Investment Advisor. Eide Bailly Advisors, LLC. is owned by Eide Bailly LLP. Eide Bailly Advisors, LLC and Symmetry Partners, LLC are not affiliated companies.
Eide Bailly Advisors, LLC and Symmetry Partners, LLC charge investment advisory fees for their services. All Eide Bailly and Symmetry Partners’ fees information can be found in the ADV Part 2A located on the Eide Bailly website www.eidebaillywealth.com and Symmetry Partners’ website www.symmetrypartners.com.
The firm only transacts business in states where it is properly registered, or excluded or exempt from registration requirements. Registration with the SEC or any state securities authority does not imply a certain level of skill or training. Different types of investments involve varying degrees of risk, and there can be no assurance that the future performance of any specific investment, investment strategy, product or any non- investment related content made reference to directly or indirectly in this commentary will be profitable, equal any corresponding indicated historical performance level(s), be suitable for your portfolio or individual situation, or prove successful. Due to various factors, including changing market conditions and/or applicable laws, the content may not be reflective of current opinions or positions. Please note the material is provided for educational and background use only. Moreover, you should not assume that any discussion or information contained in this material serves as the receipt of, or as a substitute for, personalized investment advice. Diversification seeks to improve performance by spreading your investment dollars into various asset classes to add balance to your portfolio. Using this methodology, however, does not guarantee a profit or protection from loss in a declining market. Past performance does not guarantee future results.
Index Disclosure and Definitions All indexes have certain limitations. Investors cannot invest directly in an index. Indexes have no fees. Historical performance results for investment indexes generally do not reflect the deduction of transaction and/or custodial charges or the deduction of an investment management fee, the incurrence of which would have the effect of decreasing historical performance. Actual performance for client accounts may differ materially from the index portfolios.
S&P 500 Index represents the 500 leading U.S. companies, approximately 80% of the total U.S. market capitalization. Dow Jones Industrial Average (DJIA) Is a price-weighted average of 30 significant stocks traded on the New York Stock Exchange (NYSE) and the NASDAQ. The Nasdaq Composite Index (NASDAQ) measures all Nasdaq domestic and international based common type stocks listed on The Nasdaq Stock Market, and includes over 2,500 companies. MSCI World Ex USA GR USD Index captures large and mid cap representation across 22 of 23 developed markets countries, excluding the US. The index covers approximately 85% of the free float-adjusted market capitalization in each country. MSCI Emerging Markets Index is a free float-adjusted market capitalization index that is designed to measure equity market performance in the global emerging markets (as defined by MSCI). The index consists of the 25 emerging market country indexes. Bloomberg Barclays US Aggregate Bond Index measures the performance of the U.S. investment grade bond market. The index invests in a wide spectrum of public, investment-grade, taxable, fixed income securities in the United States – including government, corporate, and international dollar-denominated bonds, as well as mortgage-backed and asset-backed securities, all with maturities of more than 1 year. Bloomberg Barclays Global Aggregate (USD Hedged) Index is a flagship measure of global investment grade debt from twenty-four local currency markets. This multi-currency benchmark includes treasury, government-related, corporate and securitized fixed-rate bonds from both developed and emerging market issuers. Index is USD hedged.
© Morningstar 2024. All rights reserved. The information contained herein: (1) is proprietary to Morningstar and/or its content providers; (2) may not be copied, adapted or distributed; and (3) is not warranted to be accurate, complete or timely. Neither Morningstar nor its content providers are responsible for any damages or losses arising from any use of this information, except where such damages or losses cannot be limited or excluded by law in your jurisdiction. Past financial performance is no guarantee of future results.
A Wealth-Centered Approach to What Matters Most

Eide Bailly Wealth
Define what matters to you today while anticipating your needs for tomorrow with a comprehensive plan.